
 GEOS SDK TechDocs|
|
GEOS SDK TechDocs|
|  2.11 Paths |
  2.13 Text
 GrGetPathRegion(), GrDrawRegion(), GrDrawRegionAtCP(), GrMoveReg(), GrGetPtrRegBounds(), GrTestPointInReg(), GrTestRectInReg()
Sometimes it's useful to be able to describe an arbitrary area of a display. Regions provide a mechanism for doing so. Regions are ideal for delimiting large, blobby areas which are relatively free of detail. They are used by the system to describe many "filled shapes."
While it is possible to define a region directly, writers familiar with paths may define a path and then call the
GrGetPathRegion()
routine. To find out how to define a region directly, see below.
GrDrawRegion()
draws a region at the passed position using the current area drawing attributes.
GrDrawRegionAtCP()
draws a region at the current pen position.
GrMoveReg()
changes the coordinates stored within a region data structure by the specified
x
and
y
offsets.
GrGetPtrRegBounds()
returns the coordinates of the passed region's bounding rectangle.
GrTestPointInReg()
sees if the passed point falls within a region.
GrTestRectInReg()
tests to see whether the passed rectangle falls entirely or partially within a region; it returns a value of type
TestRectReturnType
specifying the degree of overlap. These two functions are very useful when using regions for clipping purposes; if a given point or rectangle is discovered to be outside the clipping region, there's no need to draw the point or rectangle.
Some application writers may wish to define regions directly without describing a path. Regions are described in terms of a rectangular array (thus the similarity to bitmaps). Instead of specifying an on/off value for each pixel, however, regions assume that the region will be fairly undetailed and that the data structure can thus be treated in the manner of a sparse array. Only the cells in which the color value of a row changes are recorded. The tricky part here is keeping in mind that when figuring out whether or not a row is the same as a previous row, the system works its way up from the bottom, so that you should compare each row with the row beneath it to determine whether it needs an entry.
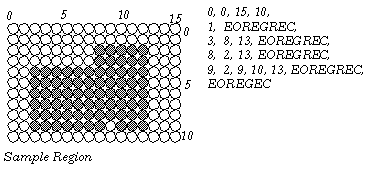
The easiest region to describe is the null region, which is a special case described by a single word with the value EOREGREC (a constant whose name stands for E nd Of REG ion REC ord value). Describing a non-null region requires several numbers.
The first four numbers of the region description give the bounds of the region. (You may encounter certain visual objects which use region structures to describe their bounds. These regions do not contain any bounds numbers. The object's drawing bounds will be used instead.)
Next come one or more series of numbers. Each series describes a row, specifying which pixels of that row are part of the region. The only rows which need to be described are those which are different from the row below. The first number of each row description is the row number, its y coordinate. The last number of each series is a special token, EOREGREC, which lets the kernel know that the next number of the description will be the start of another row. Between the row number and EOREGREC are the column numbers where the pixels toggle on and off. The first number after the row number corresponds to the first column in which the pixel is on; the next number is the first subsequent column in which the pixel is off; and so on.
The figure below shows a simple region, along with the numbers used to define it. Those rows which are the same as the rows beneath them have no entry in this structure. Notice that rows four through seven, being the same as row eight, have no entries.
It is possible to customize a region by taking advantage of a feature of the coordinate system. Graphics routines take word-sized (16-bit) coordinate arguments. Normal coordinates only require 15 bits. When working with regions, the graphics system uses the extra bit to allow for coordinates that are described in terms of "parameters."
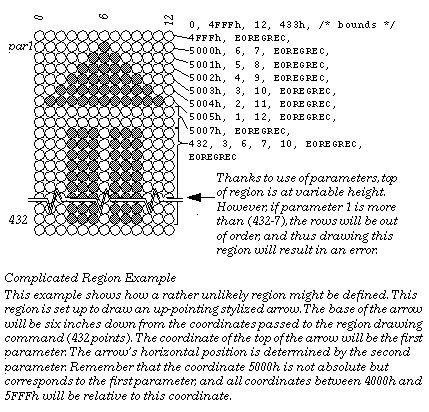
When you create a region you can specify coordinates as an offset from a parameter . When the region is initialized, up to four parameters may be defined. Coordinates may then be specified as 13-bit offsets from any one of these four parameters. When drawing the construct, new values may be passed for the parameters. In this way, it is possible to use a single region to describe a variety of shapes, just by changing the parameters.
Coordinates with the values shown below will be interpreted as offsets.
Thus, if a coordinate in a GString were 5000h, and the region were drawn with parameter zero equal to 72, then that drawing would take place at the coordinate 72. The coordinate 4FFFh would be interpreted as 71. Use the following constants to clarify parameterized coordinates:
/* Constants for DrawRegion */
#define PARAM_0 0x5000
#define PARAM_1 0x7000
#define PARAM_2 0x9000
#define PARAM_3 0xb000
Some or all coordinates of a region description may incorporate parameters. Note that the region code doesn't check regions for correctness. If the bounds of a region are set incorrectly, the rows are given out of order, or an incorrect (odd) number of on/off points is given for a row, the results are undefined.
GEOS SDK TechDocs|
| 2.11 Paths | 2.13 Text