I continue to check my little dashboard of San Francisco COVID-19 numbers each morning. Lately, those numbers have snuck upwards; I'm thus stopping going inside public places for not-so-essential things.
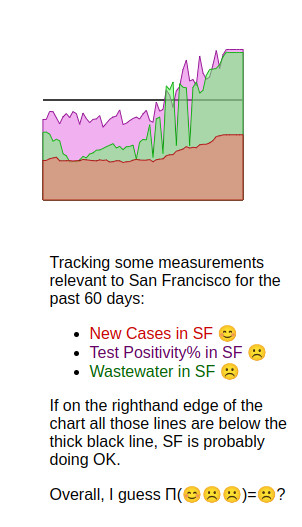
I probably would have stopped doing inside-inessentials on Saturday, but the California Open Data Portal hit some snag in publishing wastewater data; it hasn't posted new data in a week and a half. If you ignore the past week and a half of wastewater data, the graph makes you think things are low, albeit sneaking upwards and I should keep an eye on them.
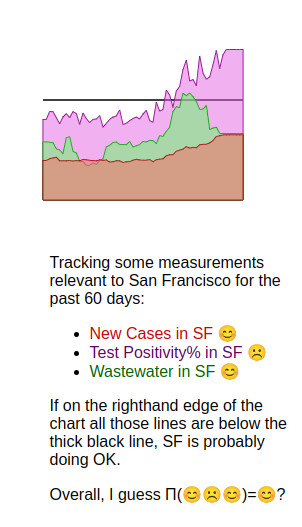
The combination of thinking I should keep an eye on them and Open-Data-Portal-hasn't-posted-new-numbers-in-a-week-and-a-half nudged me to fetch wastewater data from the California Department of Public Health. They're really good about posting data often! Still, I'd prefer to use the Open Data Portal because the Department of Public Health pre-computes numbers instead of posting raw data; the result is pretty noisy. Imagine looking at the green line each morning; I think I'd be pretty nervous:
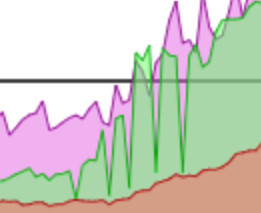
Data scientists are looking at that graph and saying "You know, you can smooth out that data…" and I'm telling you that is the smoothed data.
Anyhow, until further notice I'm buying my burritos from food trucks and not going into indoor taquerias. And I'll keep refreshing the California Open Data Portal page, hoping that they un-kink their data pipeline and post fresh numbers again.