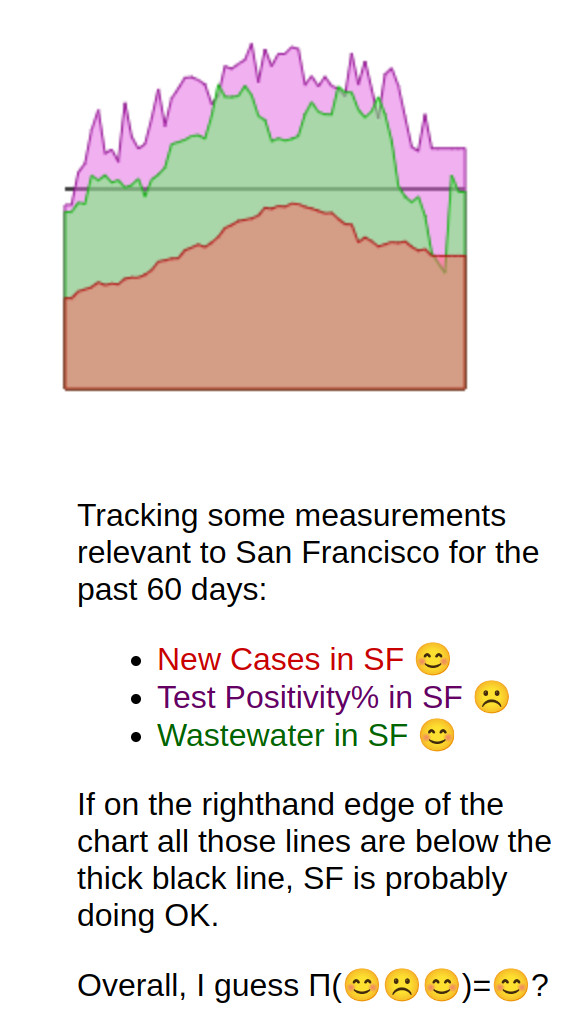
I continue to check my little dashboard of San Francisco COVID numbers each morning to figure out whether heading into a deli for an inessential sandwich is living the good life or a stupid risk. Today, I'm resuming going inside inessential places.
It feels a little strange to post this "I'm resuming inessential activities" message as I see Mastodon toots go past
saying "Overall USA COVID-in-wastewater levels are surging!" But it wouldn't be the first time San Francisco was
out of step with the rest of the nation, COVID-wise or otherwise. I won't be shocked if San Francisco's COVID
levels rise again soon as happy-go-lucky tourists from around the country come bearing gifts infections.
Note that my "safety" estimate is just: multiply together the three numbers I track and compare them to multiplying together three pretty-safe levels for those numbers. If you say "That doesn't sound very scientific," I agree with you. 🤷 Alas, I haven't heard of a super-scientific measure that applies since California stopped emergency-level testing requirements. Folks who only consider test positivity % don't want to head out for inessential sandwiches today. Folks who only consider COVID-in-wastewater levels, uhm, do the Hokey-Pokey from day to day as that noisy measure yo-yos up and down. When I eyeball the chart, I'm pretty sure that there was some kind of peak about a month ago and that things are better now; but are things good enough now? I guess so, but your guess may differ.