[Update: Though this blog post says the test% is above the "pretty-safe" line, as more data trickled in, that was no longer the case. As of a couple of weeks later, data about late June was still trickling through the pipeline. If you asked me "Is the test% level above or below the 'pretty-safe' line?" I'd say: I dunno; but it was below the "pretty-safe" line in early July.]
I continue to check my little dashboard of #SanFrancisco COVID numbers each morning to figure out whether visiting the comic book shop in person is a nice excuse for an errand or the moment my doctor will pinpoint, asking "You gave yourself long-term heart problems by picking up a funnybook about a barbarian with a talking axe?" Lately, one of the numbers I track has whooshed up from pretty-safe to not-so-safe, so that now ⅔ of the numbers I track are not-so-safe:
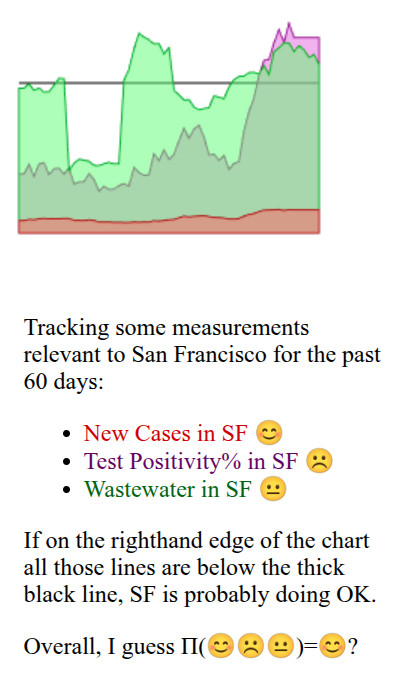
San Francisco's COVID test positivity recently went up steeply…and then slowed down. Maybe it's peaking and will fall again? (That would be nice.) Maybe it's just pausing a bit before zooming up again? (I hope not.)
I'm still doing indoor errands. But I remember at least one person mostly made their go/no-go decisions based on % test positivity; I bet they're staying home these days. And people who make go/no-go decisions based on wastewater data have maybe been staying home for a while.