Arty things I saw on my #SanFrancisco walk this morning:
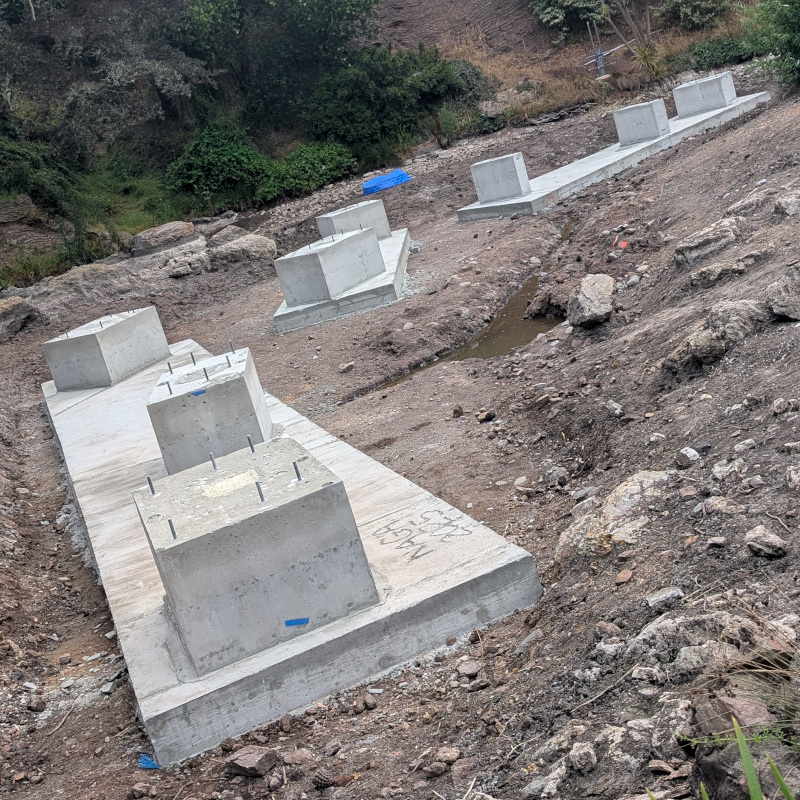
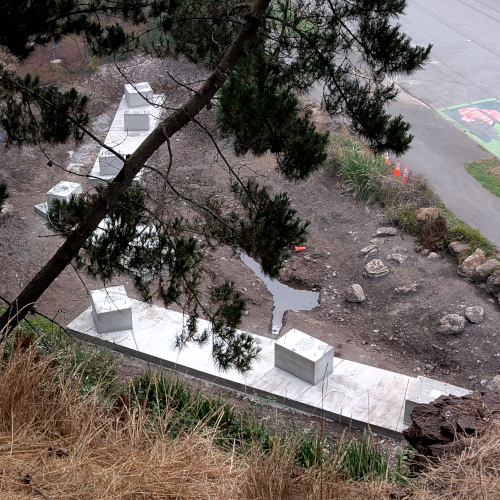
Cement infrastructure for the "Naga" sea serpent statue going in at Rainbow Falls. The statue is sinuous but it's easier to make rectangular cement forms. So…depending on whether you're near or far, you might think this thing was gonna be all right angles or serpentine. (I walked up the path to the creepy Celtic cross so I could take the far picture, please clap)
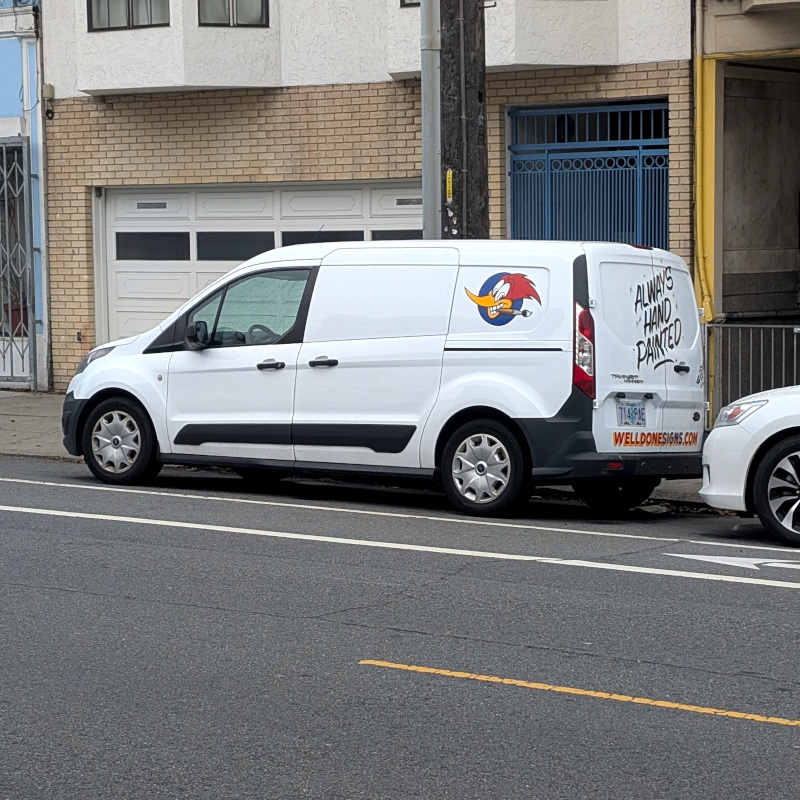
Well Done Signs sign painter's van with woodpecker logo promising "Always Hand Painted." (Looking at the web site, I guess this van is visiting from Portland, OR.)
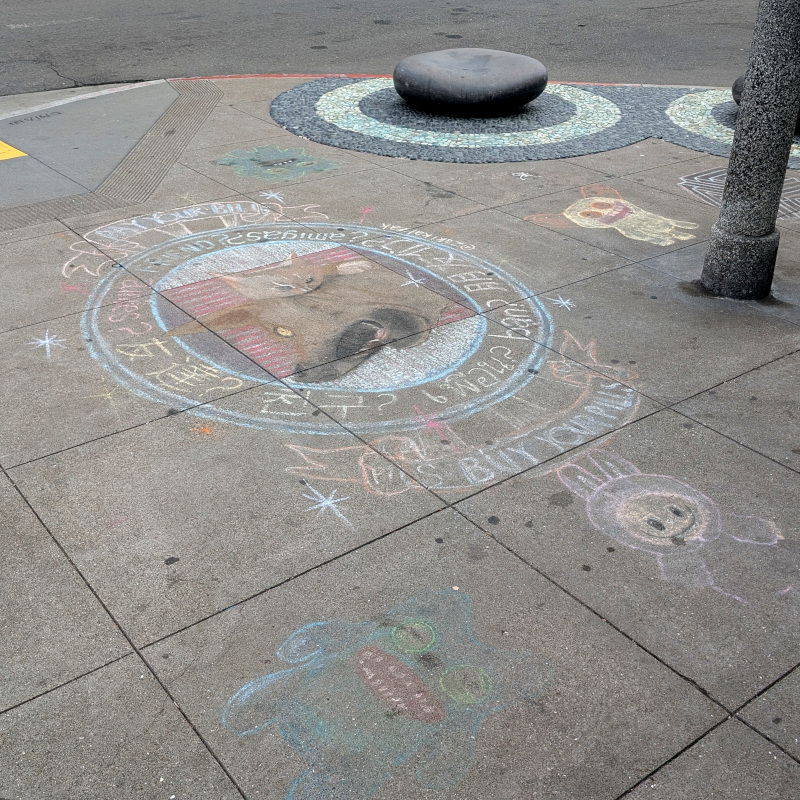
Sidewalk chalk art at 20th and Irving (alas, pretty scuffed by the time I got there) asks a very American question: Pay your bills or buy your pills?
Permalink
2025-06-29T16:29:30.959040
A swimming pool develops a crack. A mother develops dementia. Everything you ever cared about, everyone you ever cared about will wither, decay, and fade away. You will wither, decay, and fade away. One character in the book, a swimmer, says "Everything is loss." She wasn't wrong; piece by piece, it all vanishes. I loved this book and recommend it and say: Brace yourself. I also noted the passage "And the time that your other brother, the lawyer, went after her boss, Dr. Nomura, when he tried to cheat her out of her 401(k)…." If that's based on a true story, then I'm glad that brother knew what to do.
Permalink
2025-06-22T00:00:16.753381
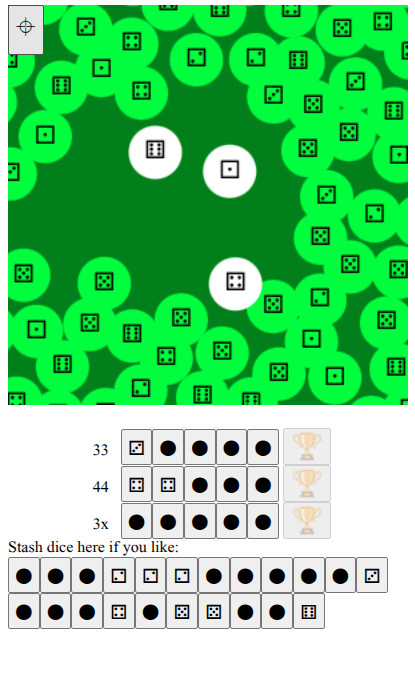
As I walk around the city for exercise and errands,
I like to play walking-around games on my phone: games
that that use GPS* to move my little guy around in
the game. I just wrote a new such game. It runs in a
web page: Walkzee.
(Because Apple hates the web, if you visit
Walkzee on your iPhone and you, like 99.9% of iPhone
users have the default web browser and haven't turned
on the enable geolocation setting, the game will do
nothing.)
I'm still tweaking the game. I play it as I walk around;
then sit down and fix bugs when I get home. As of today,
it might be of more interest to Mystery Hunt players than
walkers: there are no instructions, so half the challenge
is figuring out how to play.
Why am I writing yet-another walking-around phone game?
The previous such game I wrote ran on top of Google Cloud Services.
You might remember
a few months back, I switched my backups
to not use Google servers, run by a will-abet-genocide-for-$$$
division within Google. Some days ago, I wondered: "Why is Google
still billing me?" My little walking-around game
didn't make Google's servers think very hard—it almost
squeaked under the threshhold to run for free. But it was a little over,
and thus Google was billing me.
I wrote this new game so that it does all of its thinking and
data storage on the phone, not on some server elsewhere on the net.
Then I shut down my old game that was running on Google's computers.
Now I won't send money directly to Google's pro-genocide division.
This means giving up some server-y features. In the old game, when
my phone broke, my score was still saved on some Google machine; so when
I got a new phone and resumed play, my big ol' score showed up. In this new
game, if I get a new phone, I'll have to start all over building up
my score. <sarcasm>oh no…</sarcasm>
(If you
do care about scores and furthermore you read this blog
mostly because you're into puzzles, have you tried
https://huzzlepub.com/?
At Huzzlepub, you can
paste in your daily Wordle, Toddle, Raddle,… uh, all
those daily puzzles, you can paste in that "share your score with
your friends" thingy, and it will let you compare your scores with your
peers, thus reminding you that Tyler Hinman is still better at crosswords
than you are.)
No, I don't think this will change Google's behavior. I'm imagining
some Google exec: "We were willing
to toss out 'Don't be evil' to get that $$$ military contract, but Larry
shut down his app and that little app pays for a cup of coffee every
four months, so—uh, make that five months, I want to leave a
decent tip or else the barista will spit in my drink." Yeah, no, this
isn't changing anything important, aside from me being able to look myself
in the mirror; well, OK, that's kinda important.
*Yes, I mean geolocation using GPS and other means.
Permalink
2025-06-16T13:41:07.929880
It's a history of the struggle to build and inhabit
public housing on the white side of Yonkers, NY, USA in the 1990s.
(If that sounds familiar but you're sure you didn't read
the book, maybe you saw the HBO miniseries?)
It was a pretty interesting, albeit aggravating read.
Why aggravating?
Yonkers' NIMBYs were national-news-level notable. In Yonkers,
they were very stubborn. Ordered by a judge to build
public housing on the east side of town, city politicians got
elected by promising to just not build that housing. Faced with
fines, they stuck to their guns. When the fines threatened to bankrupt
the city, when the city had to fire workers, when…
Their appeal went up to the US Supreme Court.
The book isn't written from the NIMBY point of view.
I suppose the NIMBYs didn't want to sit down with the
author and recount their tales of hurling racist epithets
back in the good ol' days. But you feel their presence in
every chapter: Voting out the sane politicians; making death
threats; hurling those epithets.
Instead we hear about the ousted Yonkers politicians and
the outside-Yonkers politicians who were trying to figure
out how to make the city comply. Do you fine the city?
Seems bad to make city workers lose their jobs just because
the city council got taken over by racists. Do you fine
the city council members? They can declare bankruptcy, and
then get re-elected by pointing out their sacrifices.
And we hear about the people who moved into the new public
housing when it was finally built. None of these people
thought of Ruby Bridges like Yep, that's the
lifestyle I'm looking for. But they had to learn how to
get along with their new neighbors, how to stand up for
themselves. There are some real moments of inspiration in
there.
Permalink
2025-06-11T14:06:03.061026
Some photos walking around #SanFrancisco 's Marina District (and the bus ride back home):
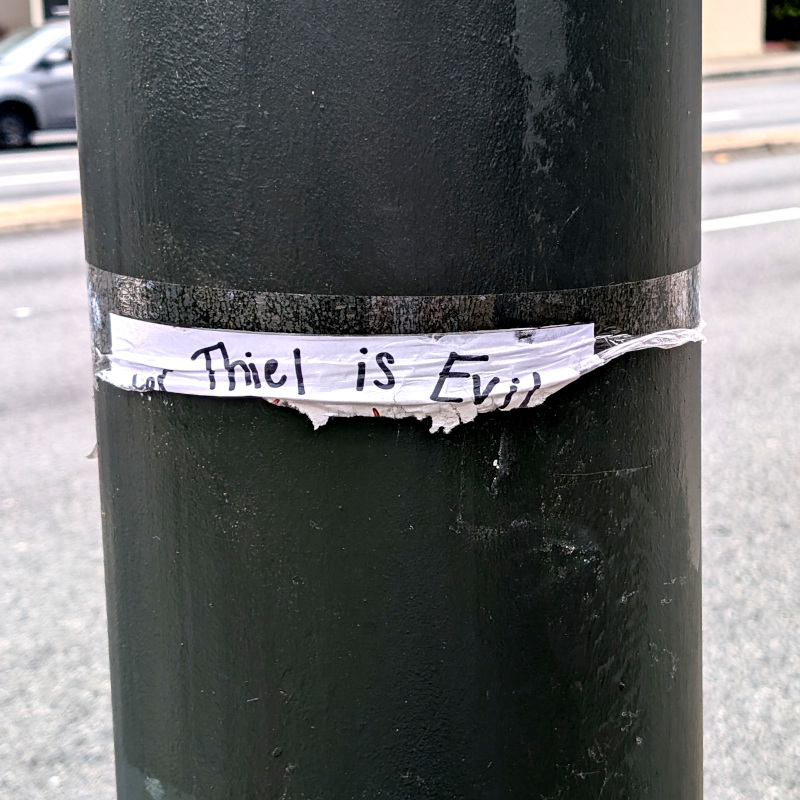
- Someone tried to tear down a flier, but instead just spotlighted the important part of the message
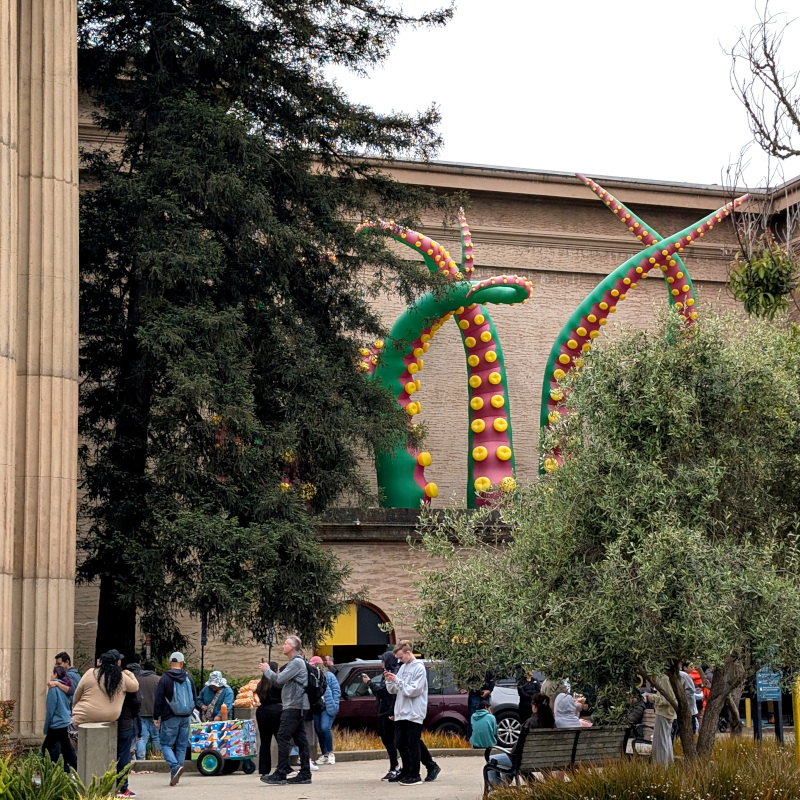
- Some tentacles atop an entrance of the Palace of Fine Arts turned out to be part of a travelling exhibit of balloon art.
As every 12-year-old San Franciscan knows, you can call it the Palace of F. Arts for short, which raises the question:
How did they fill all those balloons?
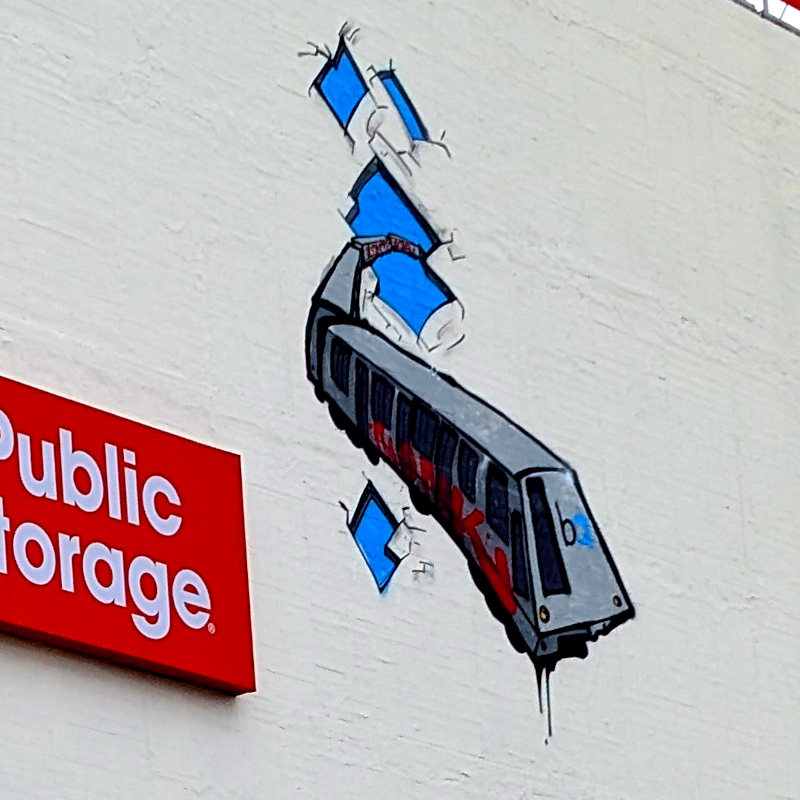
- A new-to-me graffito on the wall above the old Lucky Penny at Geary+Masonic. Sorry for the awkward angle; I snapped this out the bus window as we rolled past
Permalink
2025-06-09T00:53:32.936325
Still wrapping my head around the new reality: My cousin quit his job with the federal government and went to work at a startup, thus increasing his job security.
Permalink
2025-06-07T17:00:00.099403
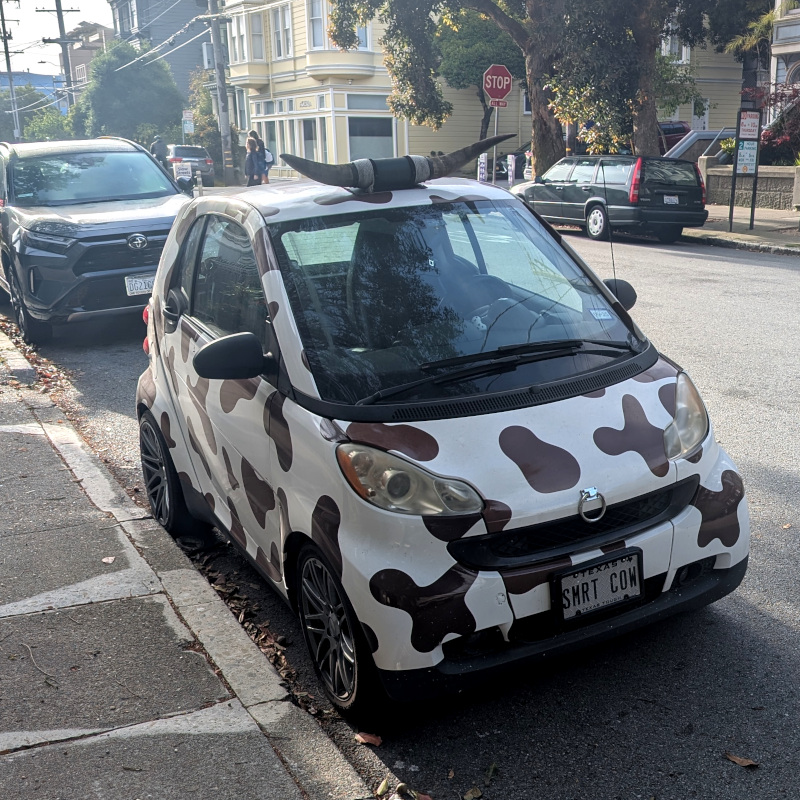
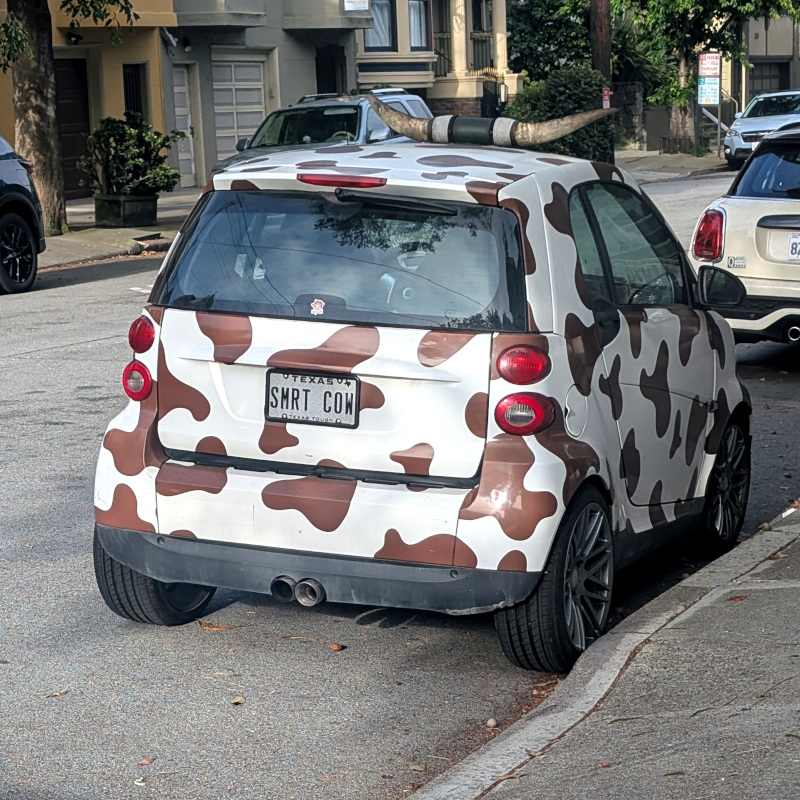
This SMRT COW "smart cow" smart car impressed me. Yep, that's a nose ring.
[Update: When I saw this car again in late June, it no longer had
the Texas SMRT COW license plate, but a message-less Calfornia plate.]
Permalink
2025-06-27T19:52:32.539409
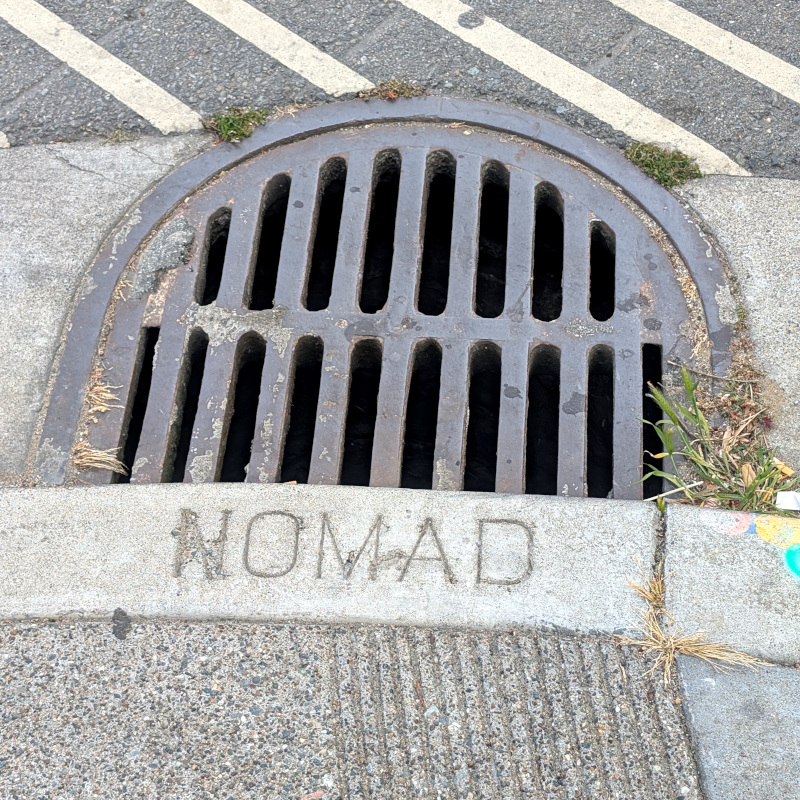
A few things I noticed on my #SanFrancisco exercise walk this morning.
The Whale's Tail, a.k.a. the summer weekend beer garden in Golden Gate Park is set up again, sorta.
Looking for info, I found a bunch of obsolete pages saying it's closed; and one page that says this is indeed opening weekend, and you can check the schedule to
see when it'll be open (many weekends between now and October-ish).
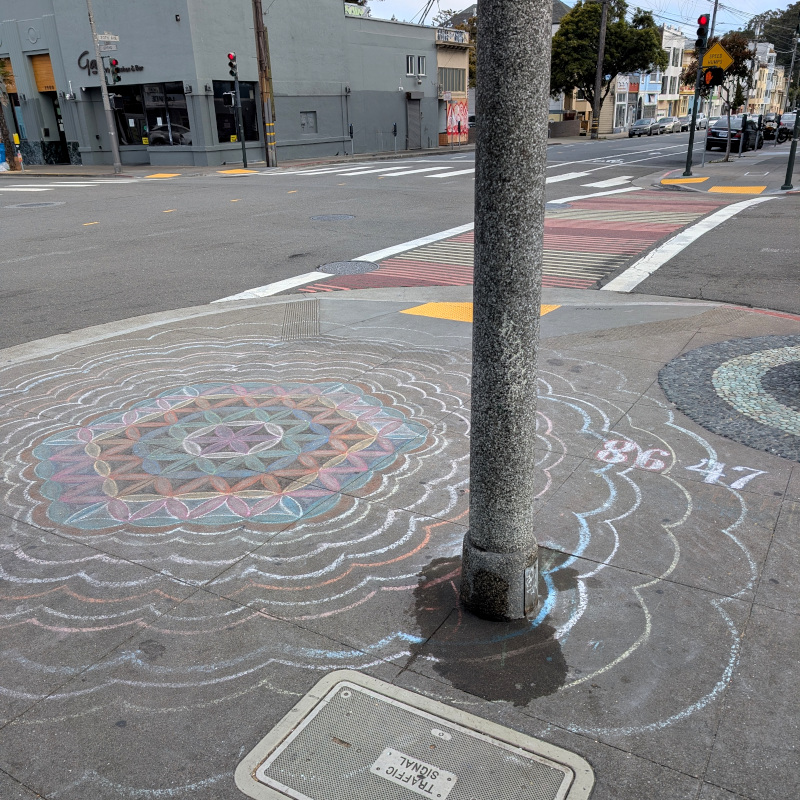
Irving Street sidewalk things: The drain near Nomad Cyclery; a pretty geometric construction for the math lovers out there.
Permalink
2025-05-25T16:41:20.205441
As I walked around the corner of the California Academy of Sciences on my morning exercise walk, I was surprised by a roar. There was an animatronic dinosaur (T-Rex?) swaying in the side yard. This was part of Dino Days https://www.calacademy.org/exhibits/dino-days . I dunno if they leave the animatronics running 24/7, but it was going as of 8 this morning.
The animatronics were moving kinda slow+stately; not exactly what I'd expect of bird relatives. I dunno if this motion reflects how we think dinosaurs move vs. slow so that the animatronics don't fall apart from flopping around too much for a few weeks.
Permalink
2025-05-17T16:31:29.210847
I snapped a couple of pics on my morning exercise walk today:
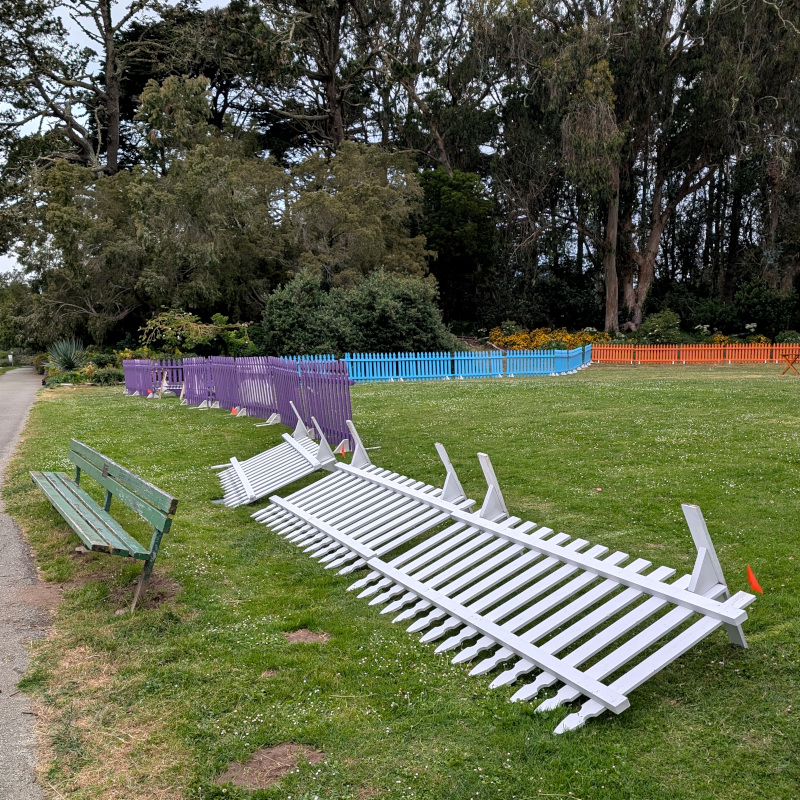
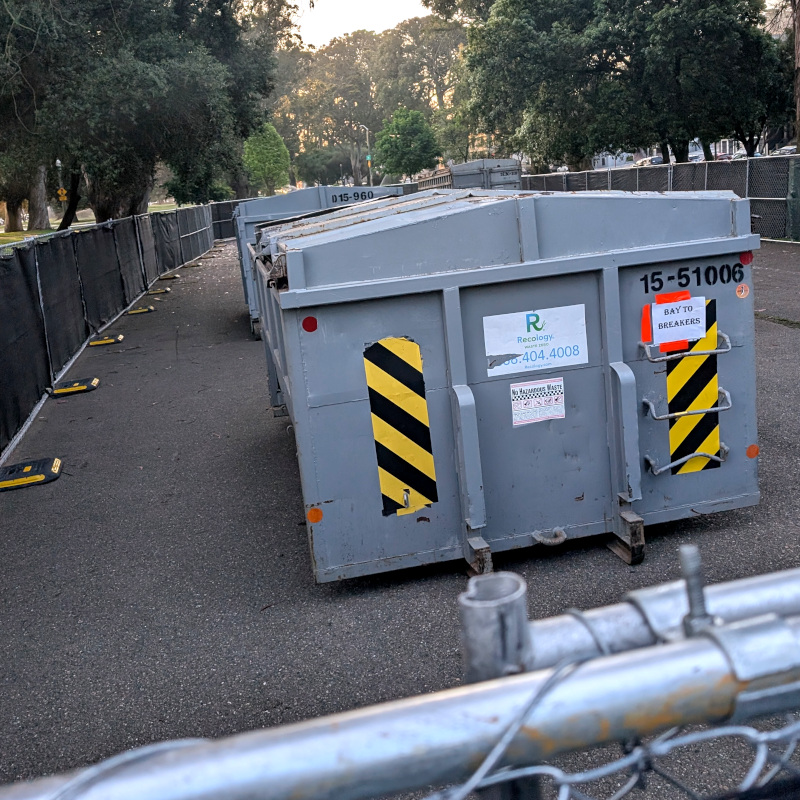
Wondering why a normally-open section of pavement in the Golden Gate Park panhandle was fenced off with some strange angular shapes inside,
I used my phone camera as a periscope.
It looks like the Bay to Breakers organizers are preparing to deploy a fleet of Cybertrucks.
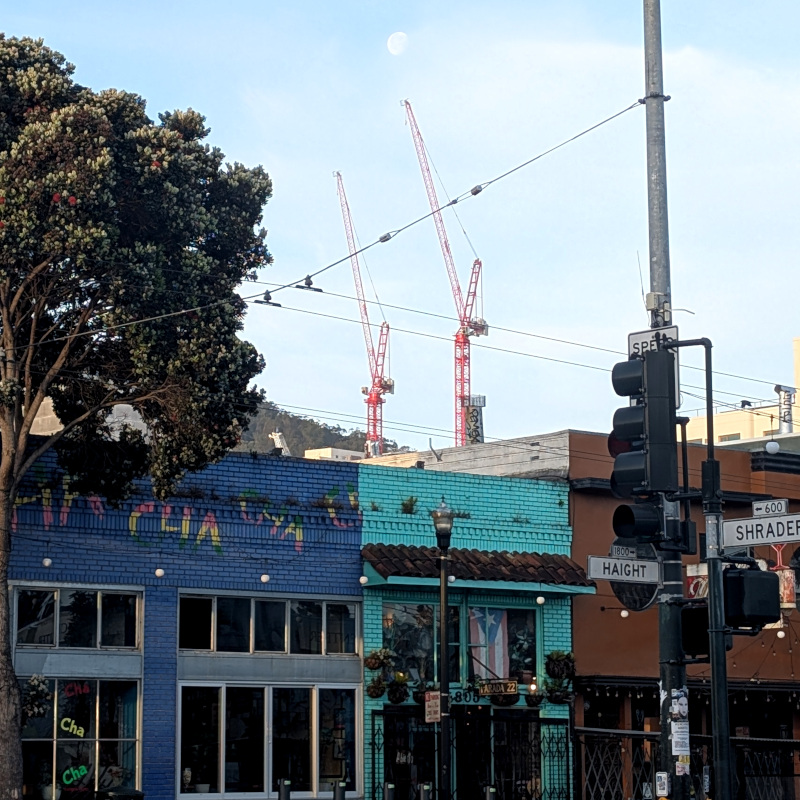
I saw a construction crane pointing at the moon and took a pic.
I tried to get my phone to auto-focus on the (faint, faint) moon, but it could only
do it on the crane.
Permalink
2025-05-16T14:21:24.418030